Digital Fleet Platform

Your fleet.
One clear picture.

Bring vessel data, AI and advanced analytics together. Turn operational insight into better decisions on fuel, emissions and maintenance.

Fleet overview

Follow your fleet around the world.

Bring your vessels together in a shared operational picture. Move from a fleet-wide overview to the vessel and measurements you want to explore.

  • Find the vessel you need to review.
  • Give crew and shore teams a shared starting point.
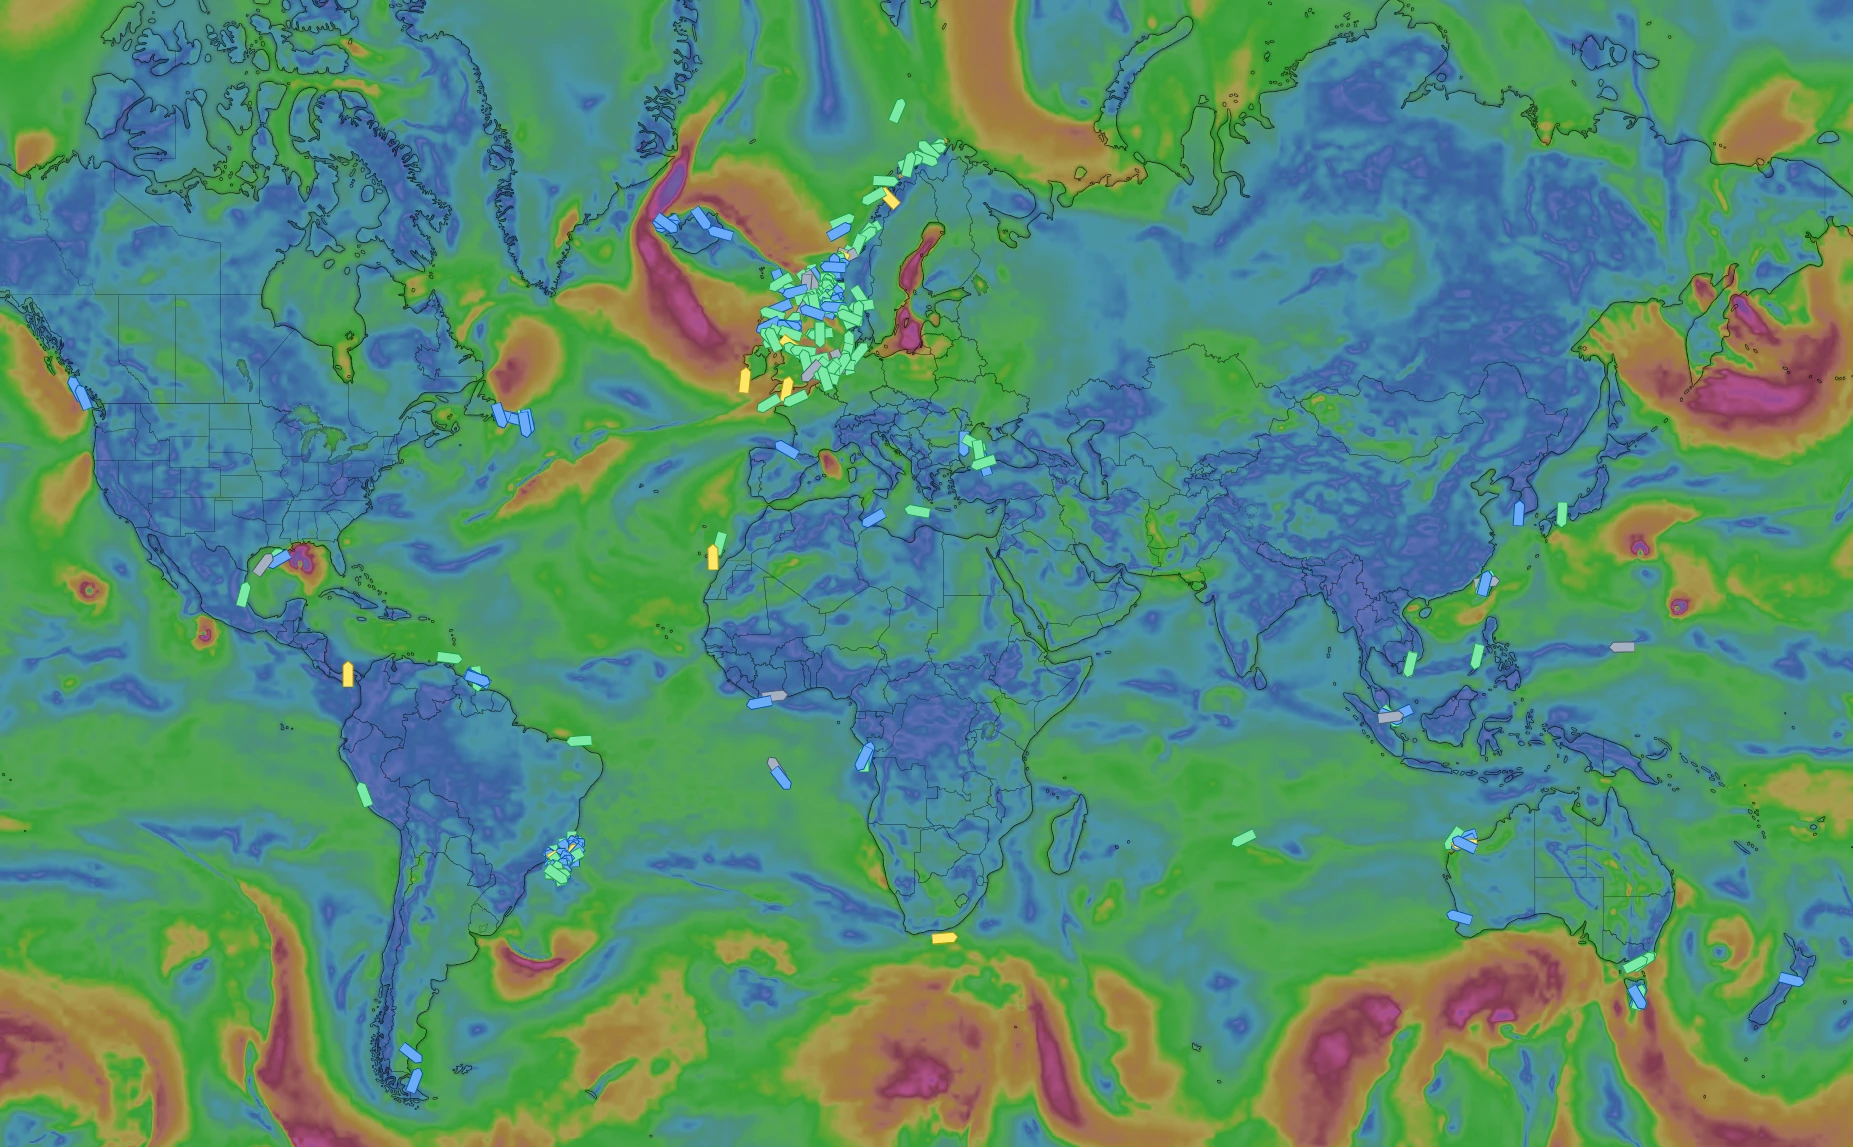
Fleet overview world map showing vessel positions coloured by status over a global wind and weather layer.
VesselGPT

Ask more of your vessel data.

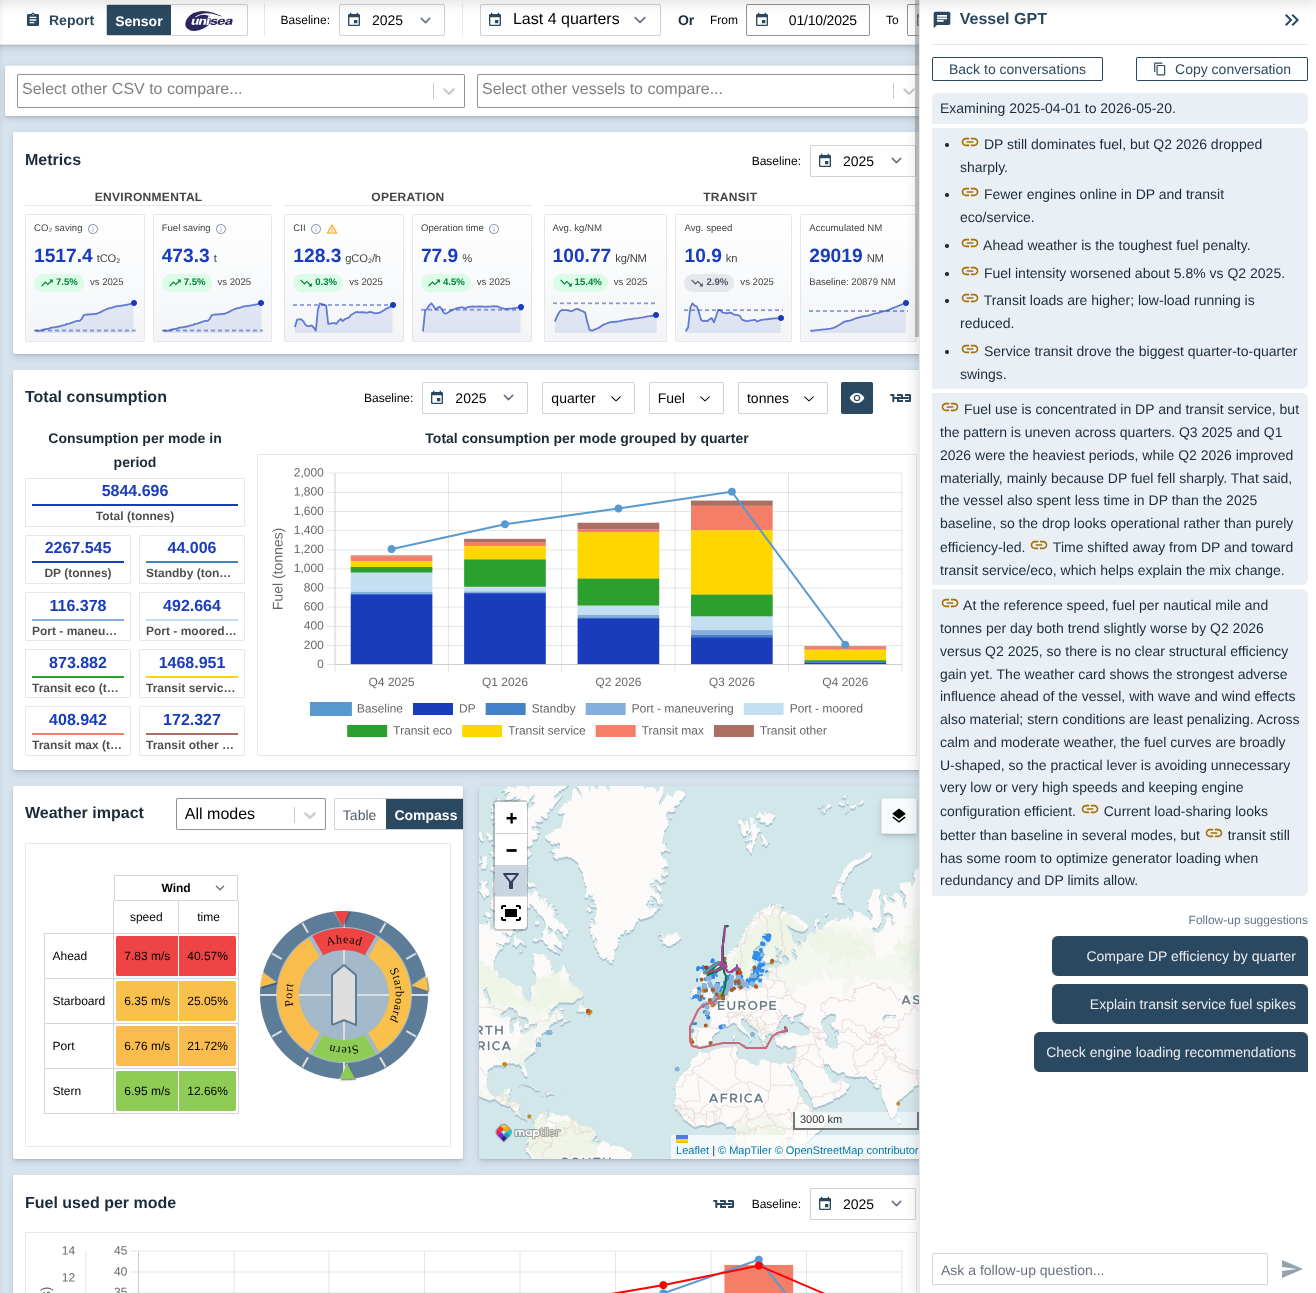
Planned LLM integration brings a conversational layer to platform modules. Ask for context and interpretation of the data, and discuss customised graphs and notifications.

  • Explore what the data means in the context of a module.
  • Discuss the questions and views that matter to your operation.
VesselGPT conversation alongside a vessel consumption dashboard, with analysis of fuel use, operating modes and weather impact.
Vessel StatusSensor integration required

Know what is happening onboard.

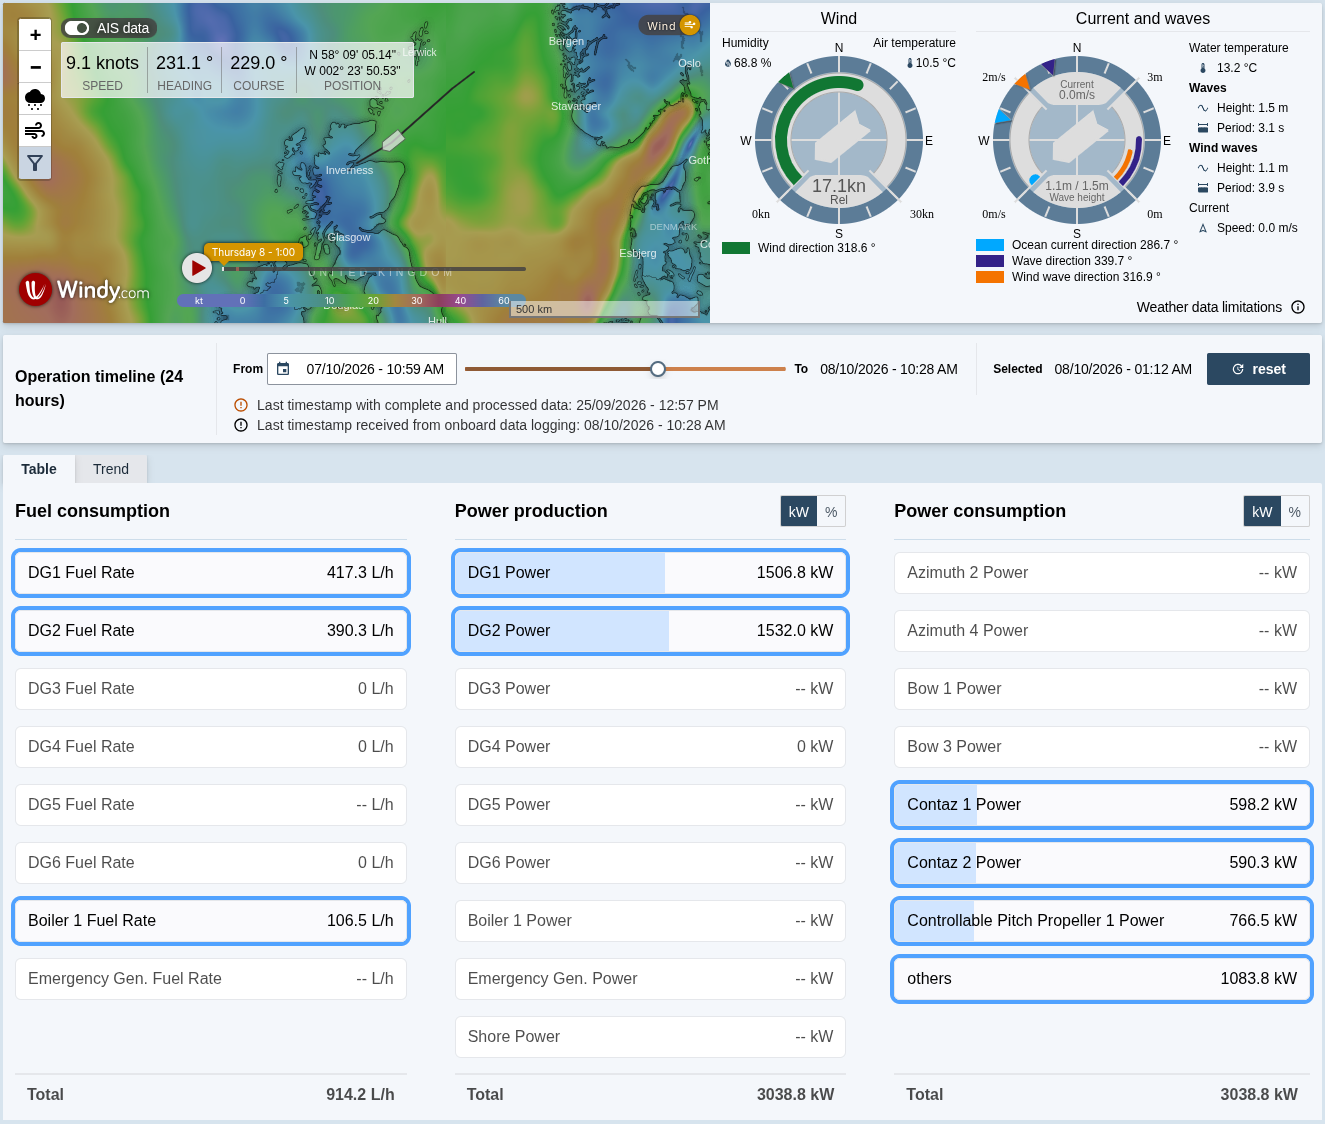
Follow operational mode, fuel consumption, power production and consumption, weather and vessel position in one real-time view.

  • Monitor the vessel in its operational context.
  • Play back historical voyages to review what happened.
Vessel Status interface with vessel position, weather map and live operational measurements.
Operations

Understand every operation. Improve the next.

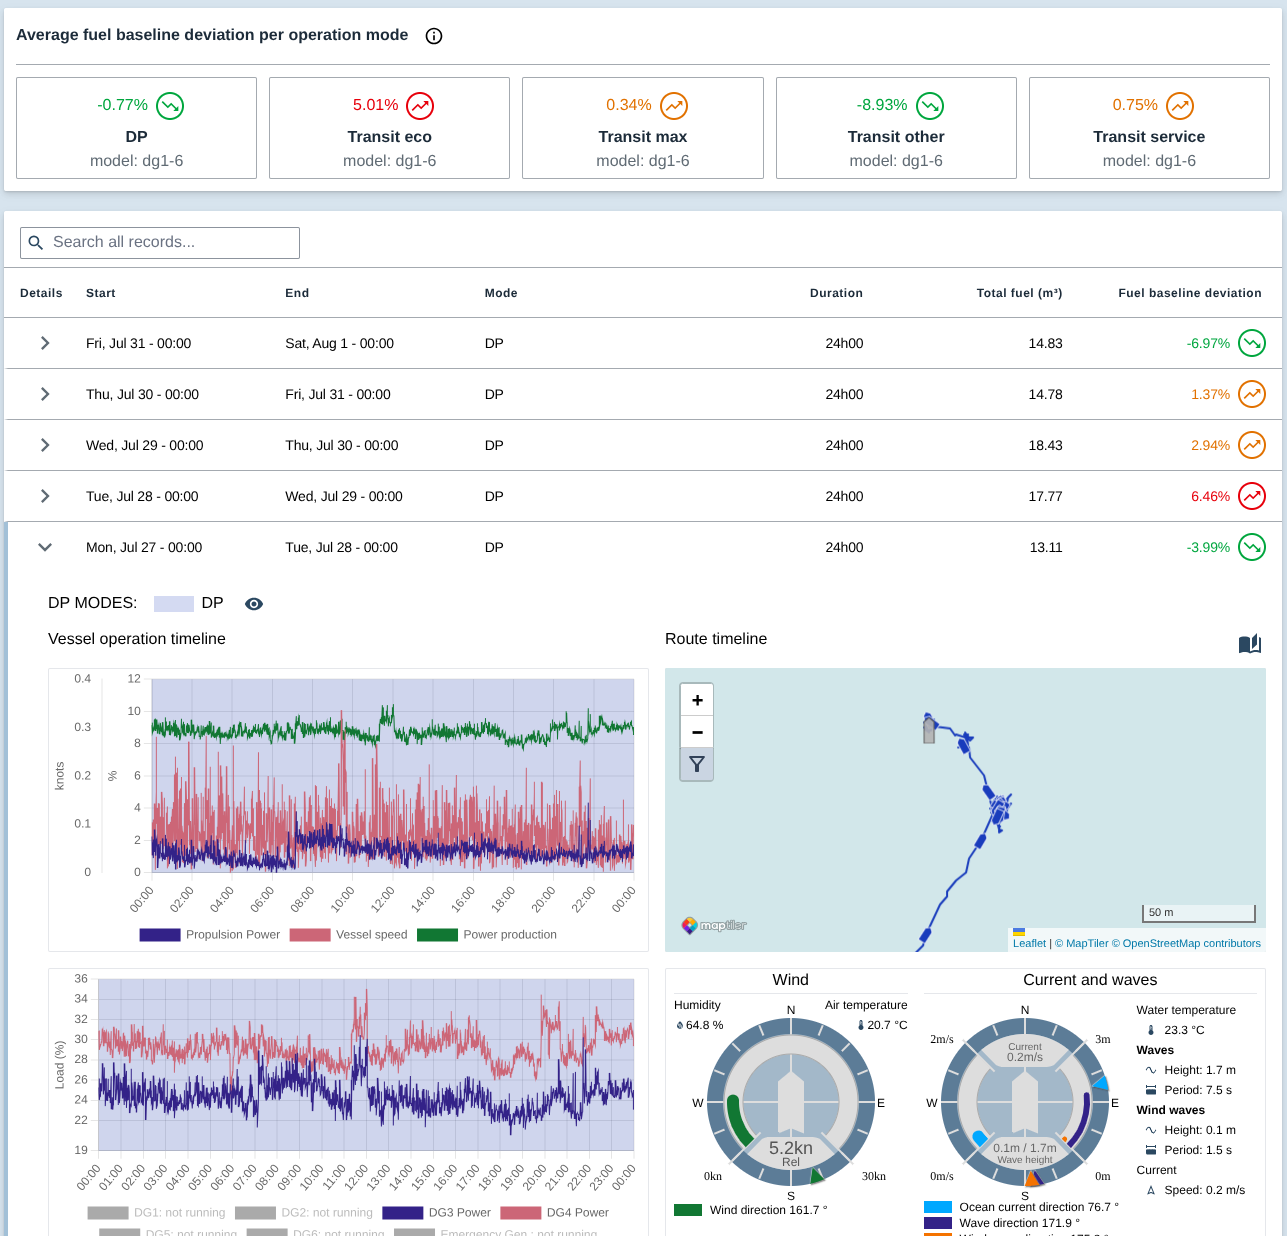
Dipai’s mode detection algorithm logs vessel operations and brings their performance into context. Review individual operations and benchmark fuel efficiency against a dynamic baseline.

  • Evaluate performance operation by operation.
  • Build a dynamic fuel baseline after one to two quarters of historical data.
Operations interface showing fuel-baseline deviations by operating mode, operation records, performance timelines and a vessel route map.
Consumption

Turn fuel data into better practices.

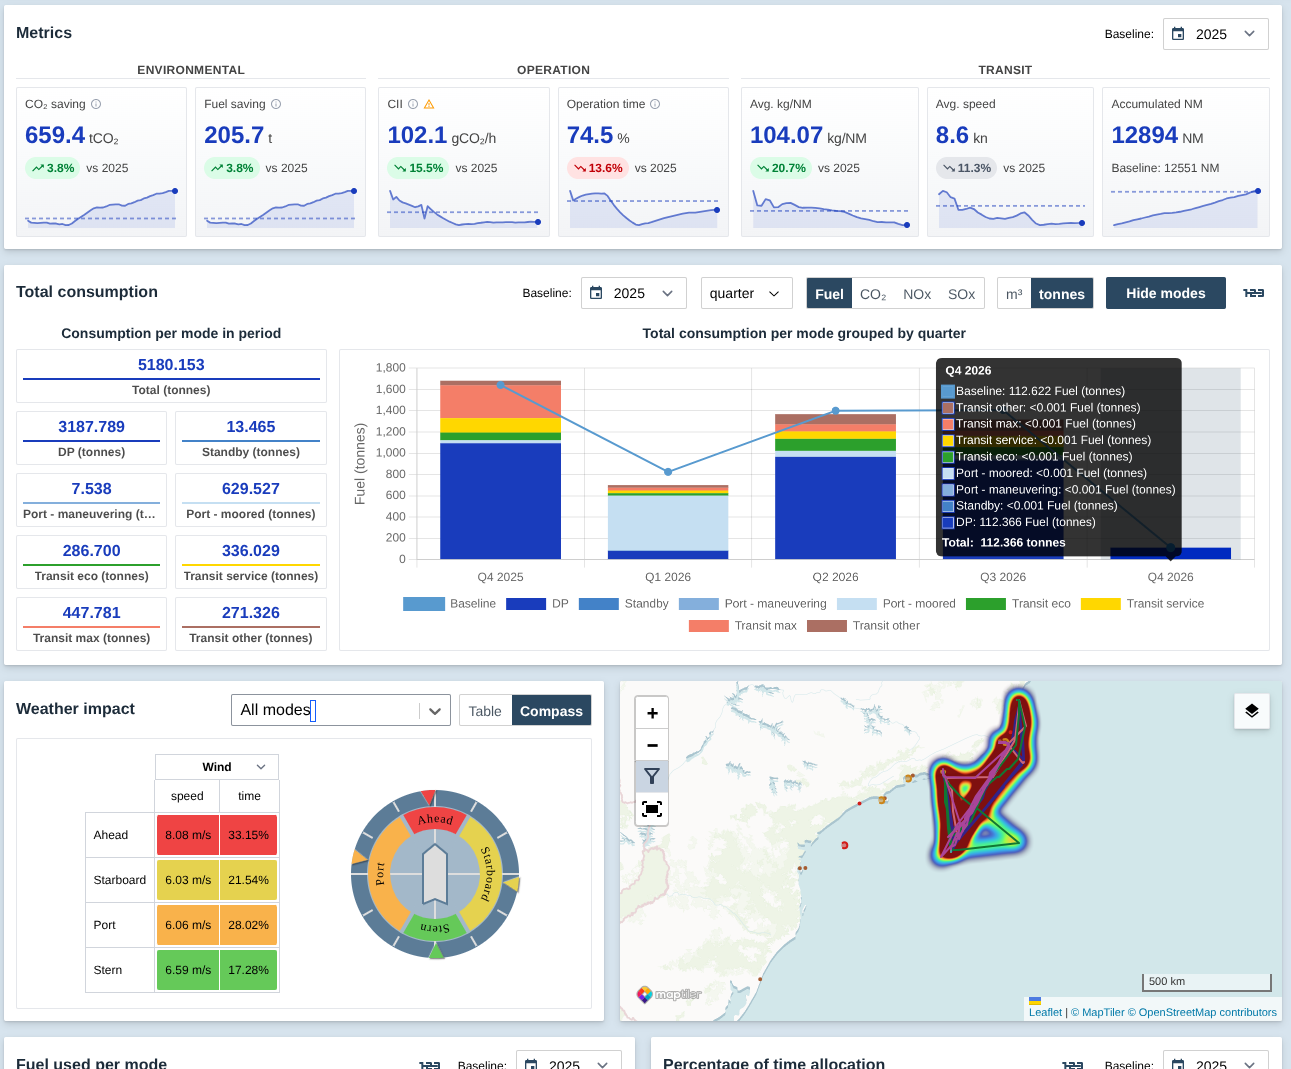
Establish and follow up on fuel-consumption best practices for each operational mode. Track the equipment in use and see how performance develops over time.

  • Trend fuel use, including tonnes per day and fuel efficiency.
  • Bring consumption KPIs together in Dipai reports.
Consumption interface showing fuel and emissions metrics, consumption by operational mode, weather impact and vessel routes.
Emissions

Know your emissions. Simplify compliance.

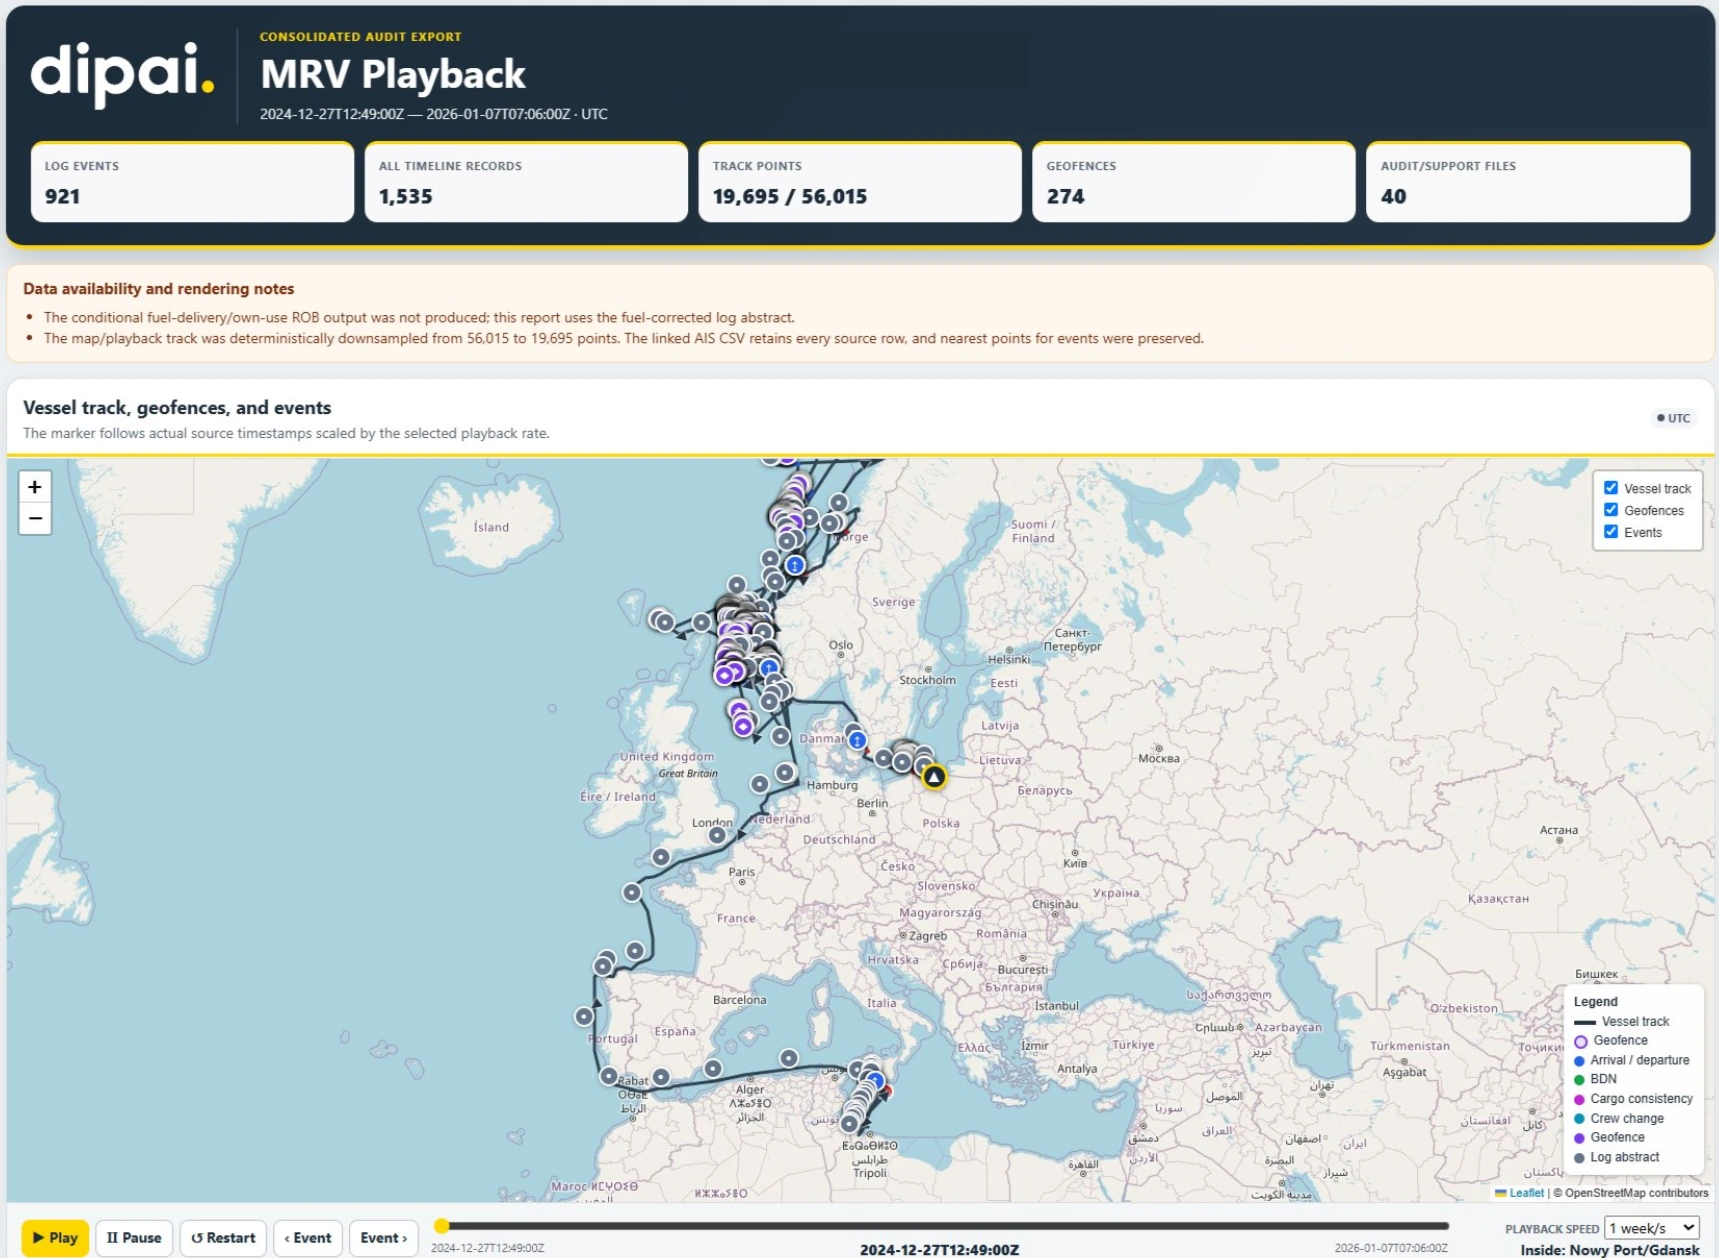
Dipai brings emissions monitoring and regulatory reporting together in one platform. Track vessel carbon intensity, understand your allowance requirements and streamline compliance with end-to-end support—from data collection to verification.

  • CII — Calculate vessel carbon intensity using the applicable IMO methodology for each supported vessel type.
  • EU MRV & IMO DCS — Simplify reporting with continuous API transfer of operational data to your verifier and hands-on resolution of data-quality issues and warnings.
  • EU ETS — Monitor emissions within scope and calculate the corresponding emissions allowance requirements.
MRV playback report showing a vessel track across Europe with geofences, port calls and logged events, plus summary counts and a playback timeline.
SEEMP

Build your next plan on real performance.

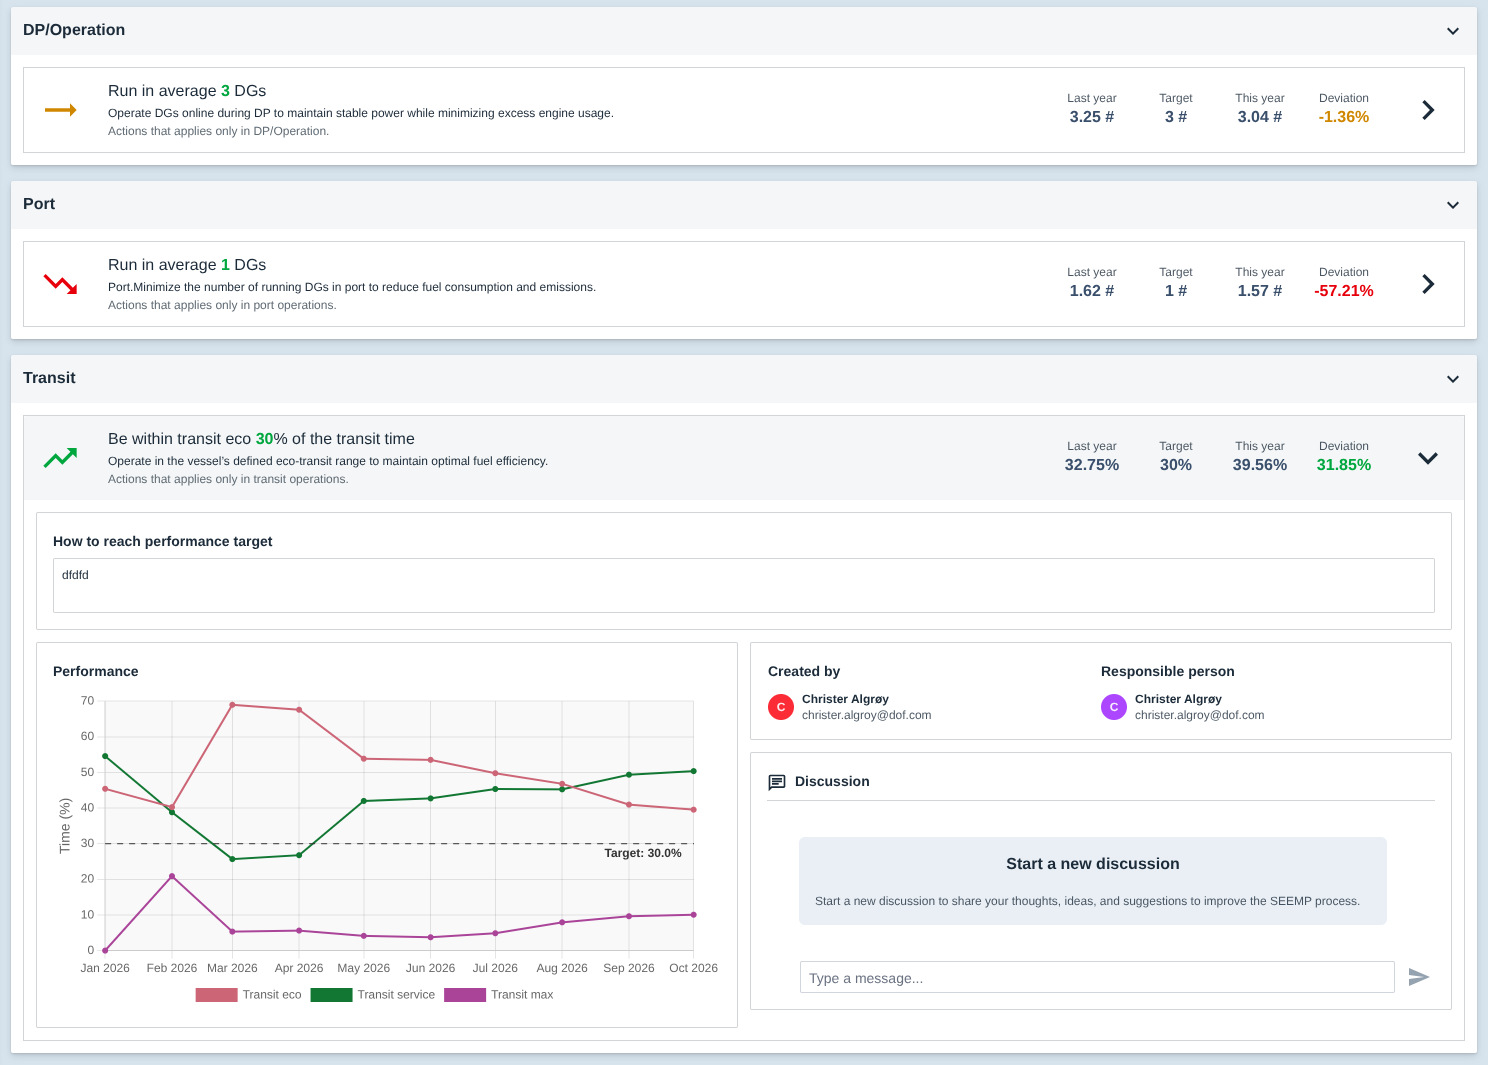
Review last year’s performance with historical data and analytics, then set realistic targets for the year ahead in your Ship Energy Efficiency Management Plan.

  • Choose from around 10–20 default actions per vessel.
  • Create custom actions and follow performance against your plan.
SEEMP action plan showing operational targets for DP, port and transit, performance trends and team discussions.
Condition-based MaintenanceSensor integration required

See the signs. Plan with confidence.

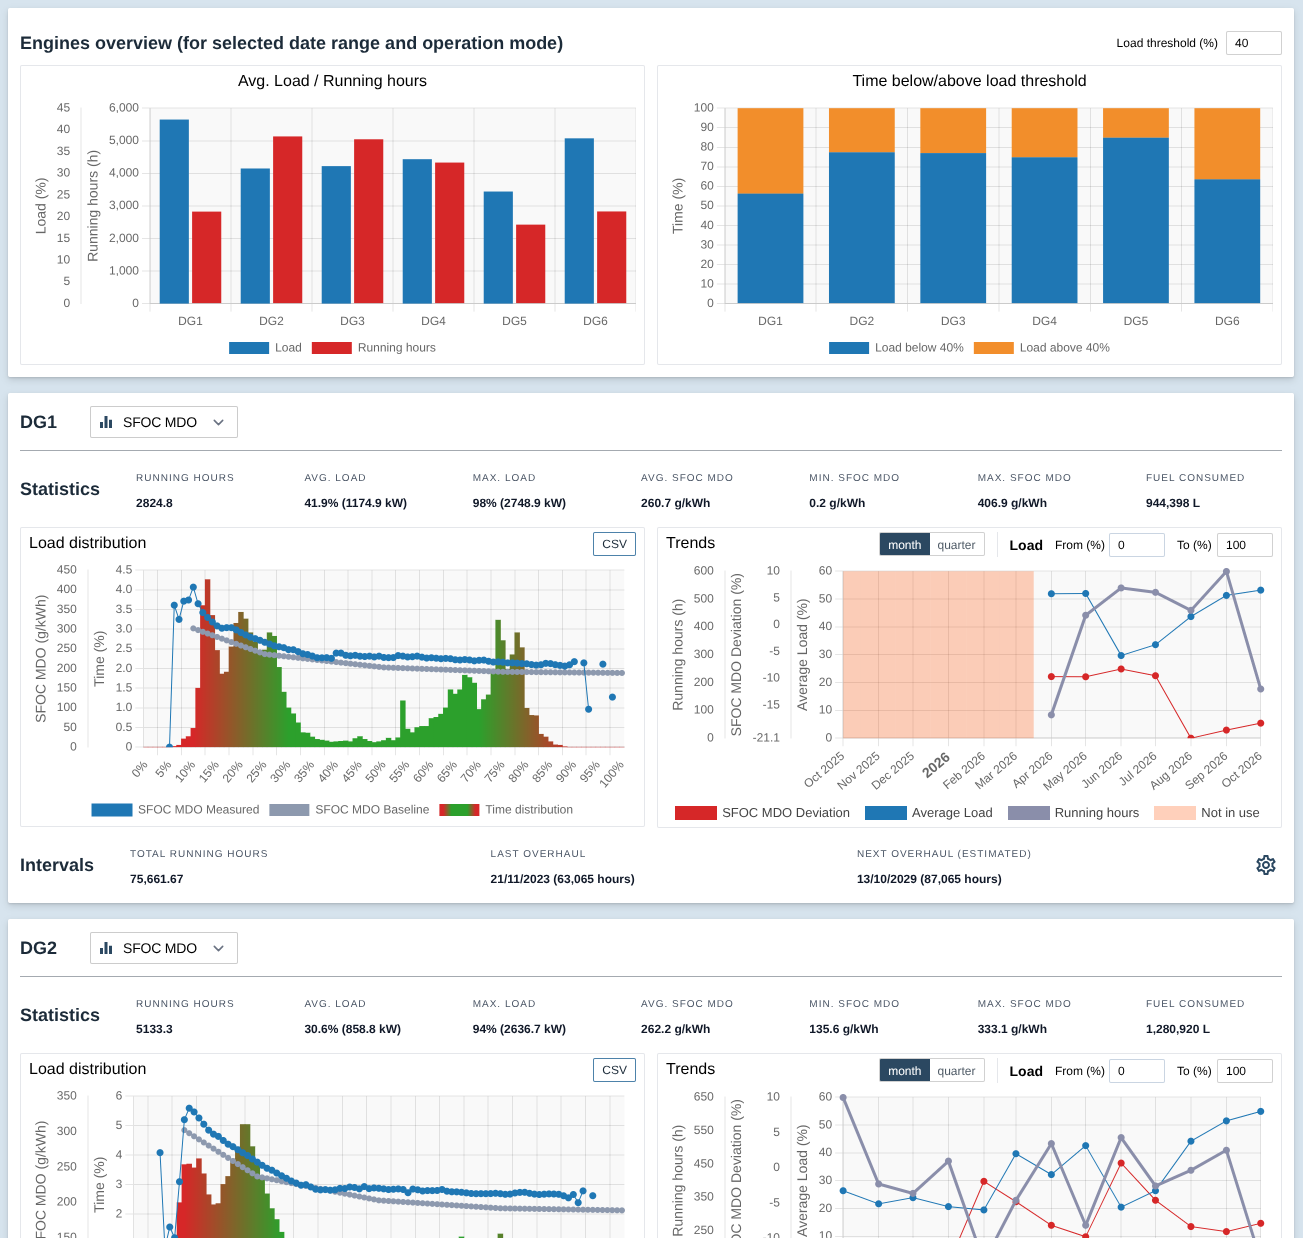
Combine machinery load profiles, onboard engine performance tests, anomaly detection and VesselGPT to identify wear and performance deviations early and trigger condition-based maintenance jobs.

  • Give crew and shore teams a shared view of machinery condition.
  • Support maintenance decisions with AI recommendations.
Condition-based maintenance dashboard showing engine loads, running hours, fuel-consumption trends and overhaul intervals.
EfficiencySensor integration required

See what made a difference.

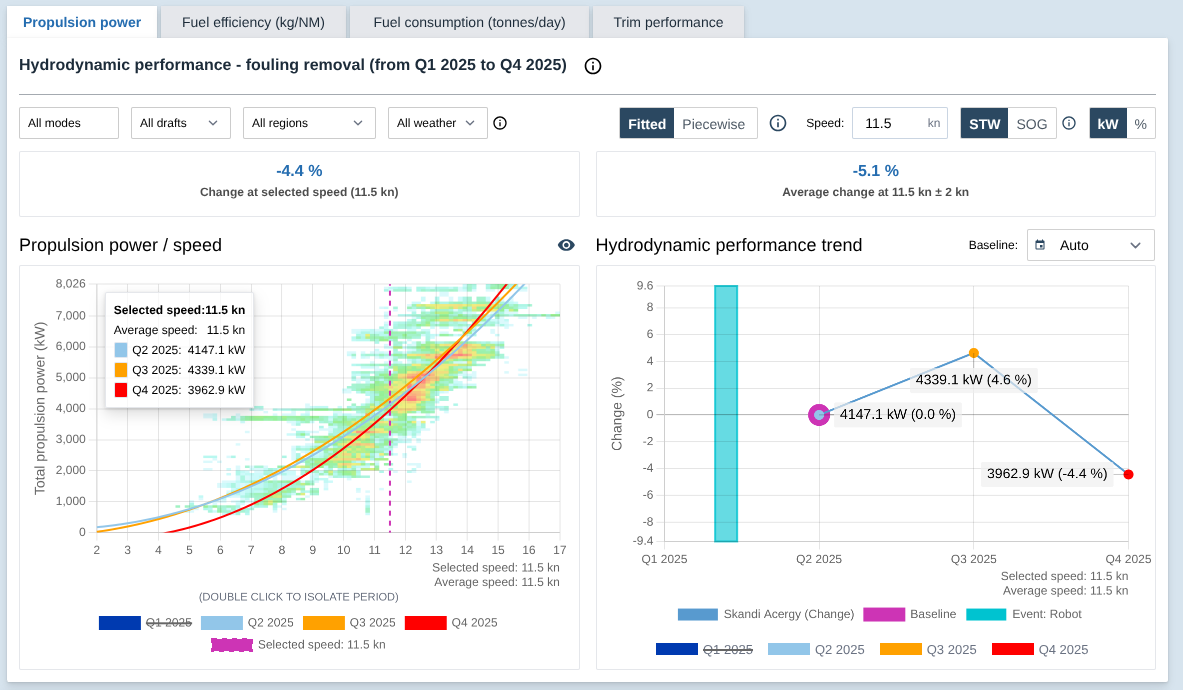
Compare vessel efficiency before and after hull or propeller cleaning, new coatings or machinery changes. Assess events using comparable operating conditions.

  • Filter by operating mode, draft, geolocation and weather.
  • Separate the effect of an intervention from changes in operating conditions.
Efficiency interface comparing propulsion power and vessel speed, with hydrodynamic performance trends across quarters.
Historical DataSensor integration required

Follow the signal back in time.

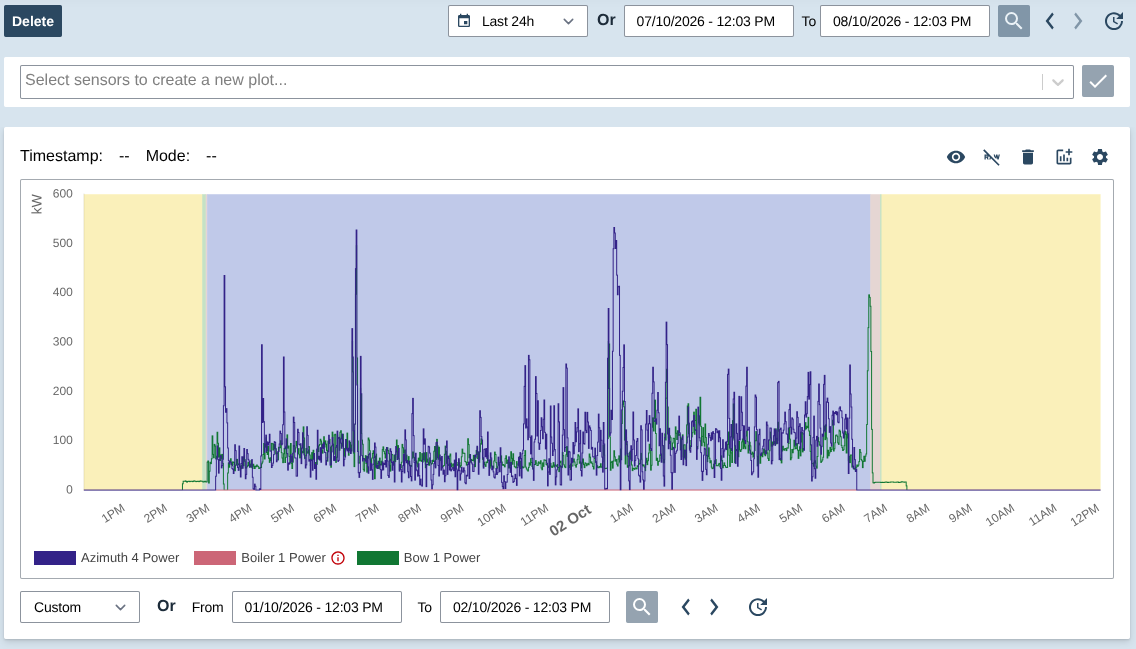
Build your own detailed analysis by trending the sensor measurements you choose. Operational-mode colours add context to the measurements.

  • Explore historical measurements in a shared timeline.
  • Interpret changes alongside the vessel’s operational modes.
Historical Data interface showing power trends over time with background colours indicating operational modes.
Data Download & APISensor integration required

Your data. Ready for your next use.

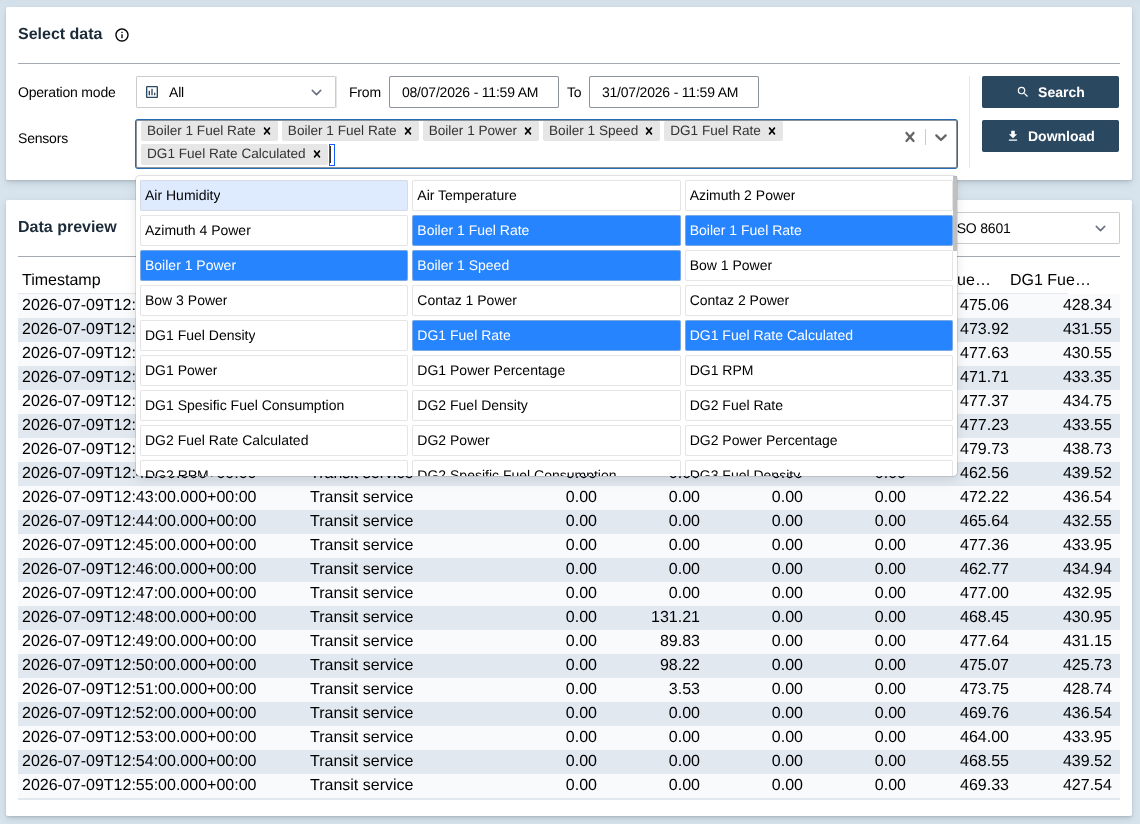
Give designated users direct access to sensor-data downloads, or use Dipai’s REST API for a continuous stream of data into your own tools.

  • Download sensor data directly from the platform.
  • Connect data to your wider analysis and reporting workflows.
Data download interface with selected sensors, date range and a tabular data preview.

A shared data foundation

Bring vessels onboard together, even when their data maturity differs. Deepen the analysis as more data becomes available.

Connected vessel: sensors on the thrusters, engines, auxiliary equipment and navigation systems stream data continuously to the Dipai platform.ThrustersEnginesThrustersAuxiliaryNavigation Continuous
Connected vessels

High-frequency insight.

Sensor integration supports the full platform, combining data from engines, thrusters, auxiliary equipment and navigation systems for detailed analysis.

Report-based vessel: noon reports, AIS position and weather data reach the Dipai platform periodically.AIS positionNoon reportWeather Periodic
Report-based vessels

A fleet-wide starting point.

Manual reports, weather and third-party AIS data support a higher-level operational view. Add sensor integration as your fleet’s digital capabilities develop.

You retain ownership of your data. Dipai supports vessel-to-cloud and secure cloud-to-cloud integration, with data sharing to your cloud or chosen third parties on request.

Let’s find the right fit
for your fleet.

Explore the modules, data connections and operational questions that matter to your team.

This website does not use analytics or advertising cookies.

About browser storage ›