Vessel performance
Measure the effect of hull and propeller maintenance
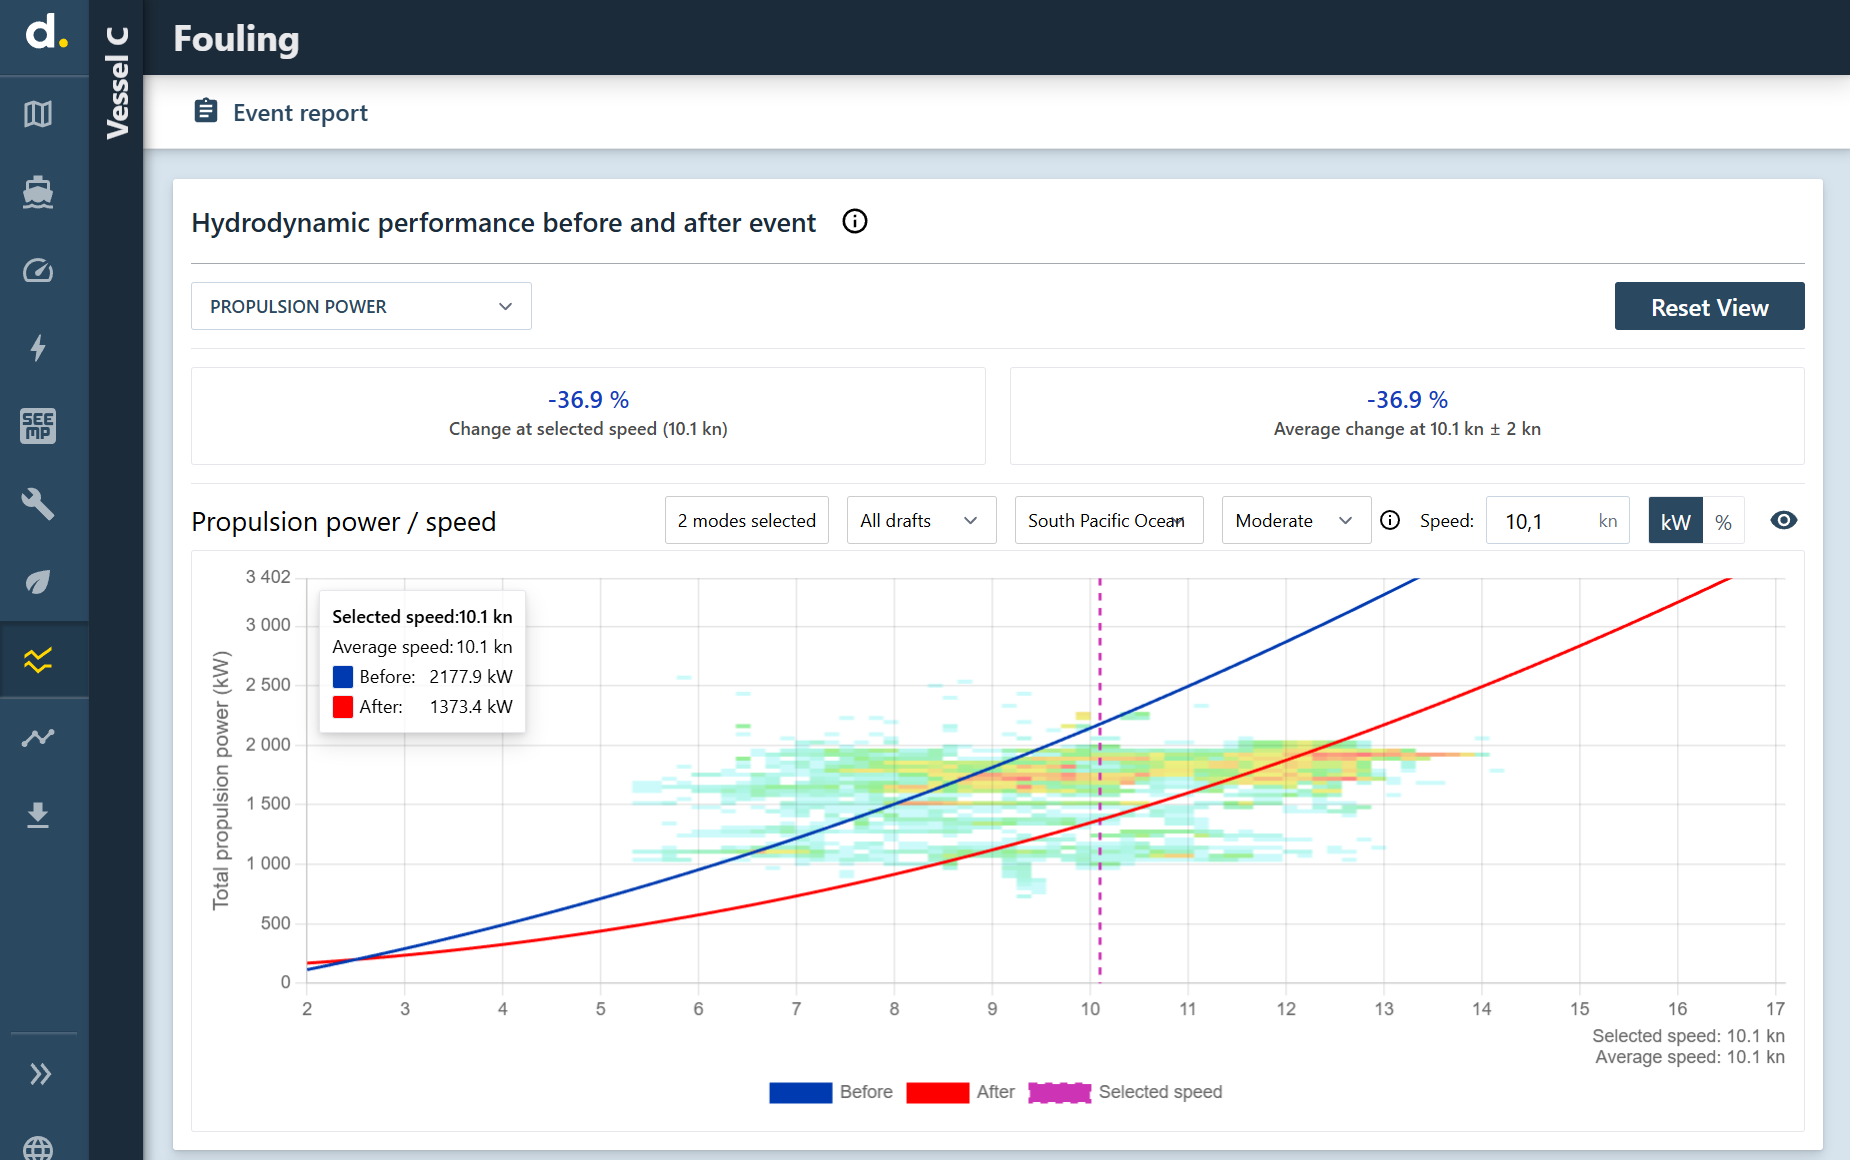
Compare like-for-like propulsion performance before and after maintenance, with a reported 36.9% reduction in power required at 10.1 knots.
- Reduction in required propulsion power
- 36.9%
- Selected comparison speed
- 10.1 kn
Changes in speed, operating mode and weather can obscure the effect of maintenance. Dipai uses high-frequency vessel data and regression models to compare hydrodynamic performance under comparable conditions.
Put performance trends in context
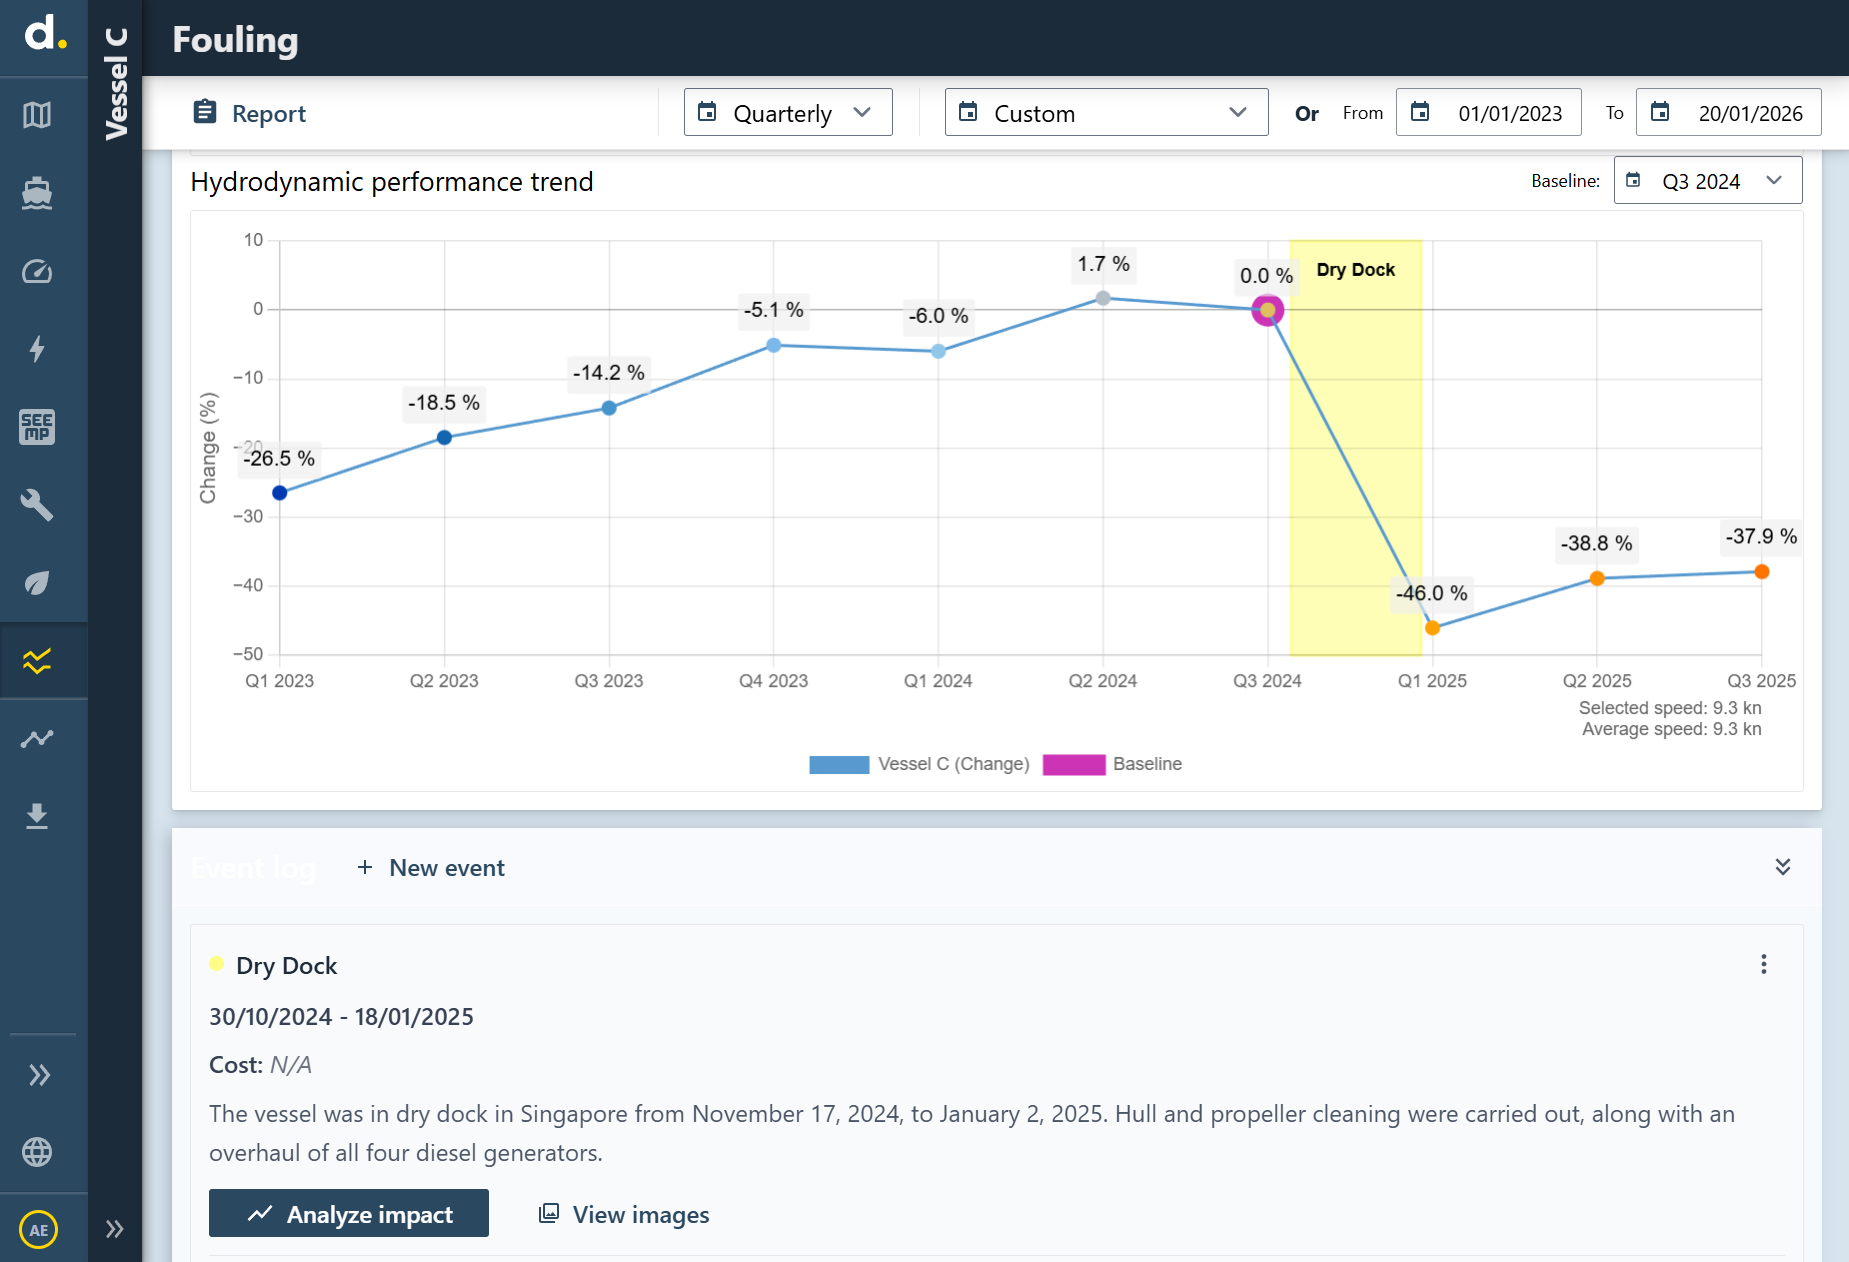
Historical monthly or quarterly performance trends can show how the vessel changes over time. Overlaying maintenance and operational events helps crews and technical teams connect a change in performance to the events around it.
The longer-term aim is to estimate an appropriate hull and propeller fouling-removal interval for each vessel.
Compare equivalent operating conditions
The before-and-after analysis uses high-frequency sensor data with regression models. Filtering helps keep the comparison consistent across operating modes, draft, region and weather.
The example shown uses selected transit modes, the South Pacific Ocean region and moderate weather. At the selected speed of 10.1 knots, the fitted propulsion-power requirement changes from 2,177.9 kW before the event to 1,373.4 kW after it.
Quantify the change in power demand
The filtered comparison reports a 36.9% reduction in propulsion power required to maintain 10.1 knots. The result measures power demand at that defined operating point.
Together, the trend view and event comparison give technical teams evidence for reviewing maintenance impact and planning future hull and propeller work.
The 36.9% figure concerns propulsion power at 10.1 knots under the selected filters. The historical trend view uses a different selected speed.